
After reading a question on (yes I know) a Facebook group about how to monitor Applocker on AADJ devices, I realized I didn’t have a blog about this topic…So here we go!
In this blog, I am going to show you why you could use Azure Log Analytics as a basic Applocker monitoring solution and of course how to setup it up step by step.
1. Introduction
I guess Microsoft describes it best… I can’t think of any better words to describe what log Analytics is
“Log Analytics is a tool in the Azure portal to edit and run log queries from data collected by Azure Monitor Logs and interactively analyze their results. You can use Log Analytics queries to retrieve records that match particular criteria, identify trends, analyze patterns, and provide a variety of insights into your data.”
But why use it? I guess if you can answer the question: Why do you need a monitoring solution? You are done….
If you don’t have a monitoring solution, you are completely blind. Do you know what’s happening on your devices and your Microsoft Tenant without a good monitoring solution?

When you are not in a position to start using Azure Analytics maybe this option from an older blog is something you could use in the meantime
But let’s go forth and let’s start using Azure Log Analytics!
2. Create Azure Analytics Workspace ..
First, we need to start to create an Azure Log Analytics Workspace (or use an existing one) it’s a prerequisite if you want to capture some logs. Open Microsoft Edge and browse to the Azure Portal
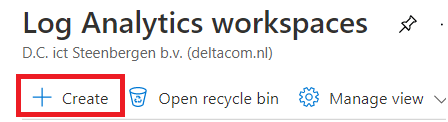
Log Analytics workspaces – Microsoft Azure
If you want to create a new one, just press create.. it can’t be simpler
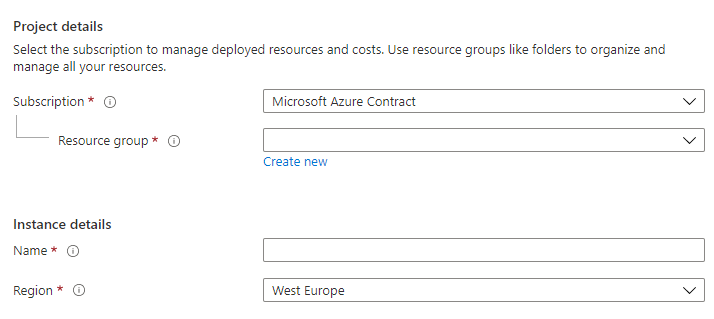
And configure the information required.
3. Deploy the Azure Monitor Agent
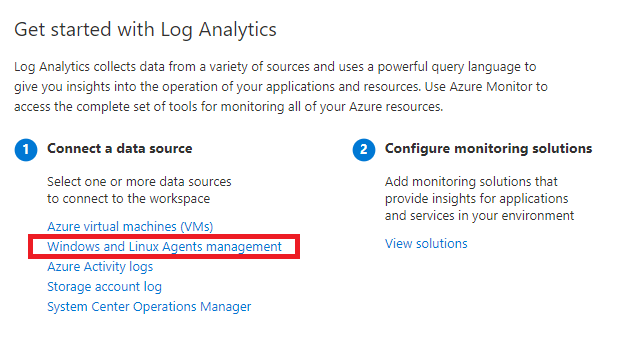
A simple method to transfer your logs to the Azure Log Analytics workspace is by installing the monitoring agent on your devices. So let’s download the agent first. To do so open the Log workspace you create earlier.
Downloading the Agent
-Download “mmastup-amd64.exe”
-Please note down the “Primary key” and “Workspace id”
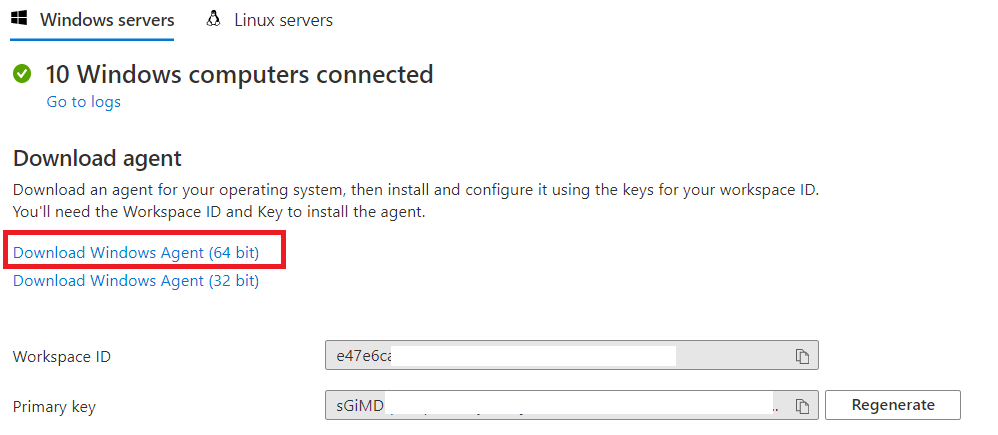
-After the Agent is downloaded extract the contents with this command: mmastup-amd64.exe /c
-Create A powershell script (install.ps1) and of course change the id and key !
.\setup.exe /qn NOAPM=1 ADD_OPINSIGHTS_WORKSPACE=1 OPINSIGHTS_WORKSPACE_AZURE_CLOUD_TYPE=0 OPINSIGHTS_WORKSPACE_ID=”Workspace ID” OPINSIGHTS_WORKSPACE_KEY=”Workspace Key” AcceptEndUserLicenseAgreement=1
-Now we need to create an Intunewin package and uploading it to Intune
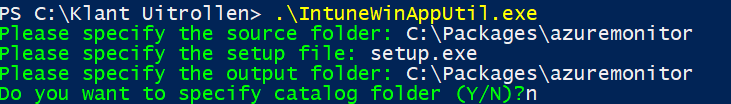
Adding the Win32app to Intune
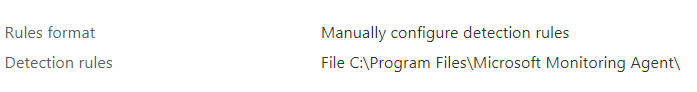
Install Command:

Detection Rule:
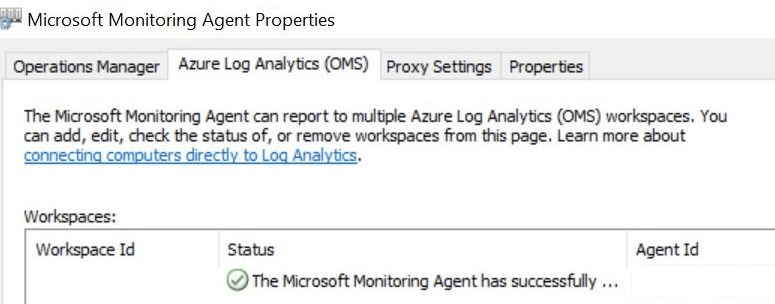
After you uploaded the App to Intune and it’s deployed to your devices, make sure it’s working and installed by opening the control panel and opening the Microsoft Monitoring Agent. Another possibility would be to open the agent from the program files folder itself
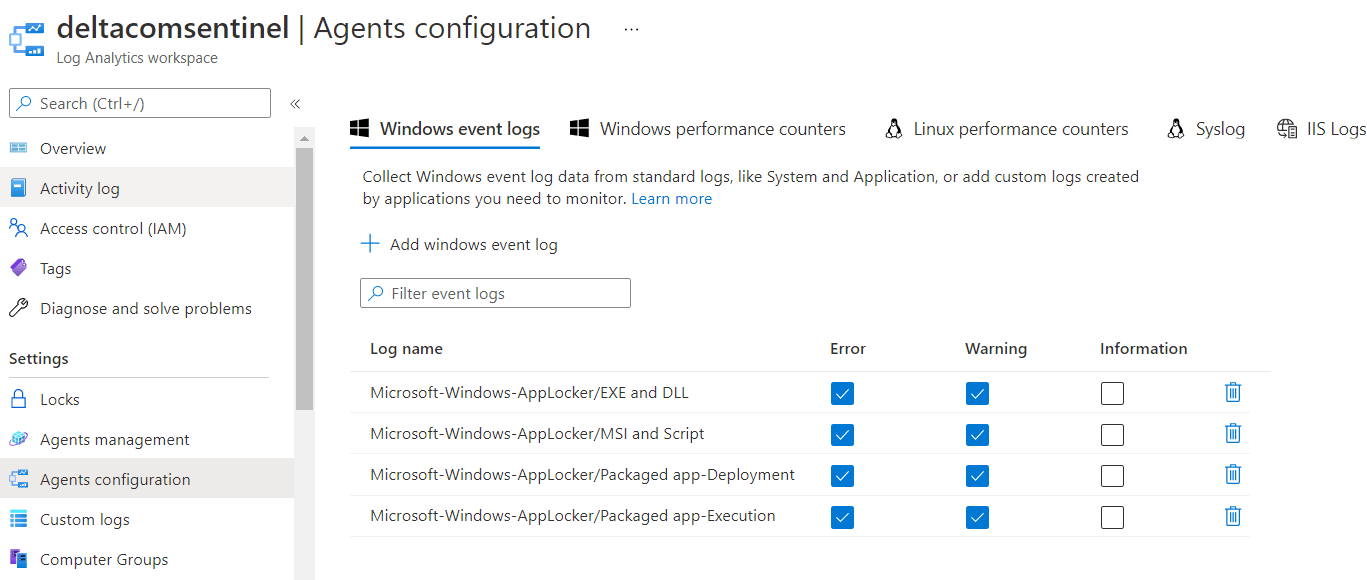
4. Adding the custom Applocker event logs
Now the prerequisites are ready we are going to add the event logs you would like to monitor (don’t forget to deselect the information events). In this example, I am only adding the Applocker event logs we want to log because I want to show you how we could build a basic Applocker monitoring dashboard
If you don’t have configured Applocker yet, please take a look at some of my blogs about Applocker and how to automate it.
5. Testing It
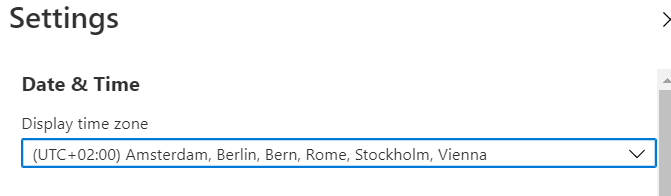
Before we are going to test it we need to configure the time zone so we are not mistaken by the time
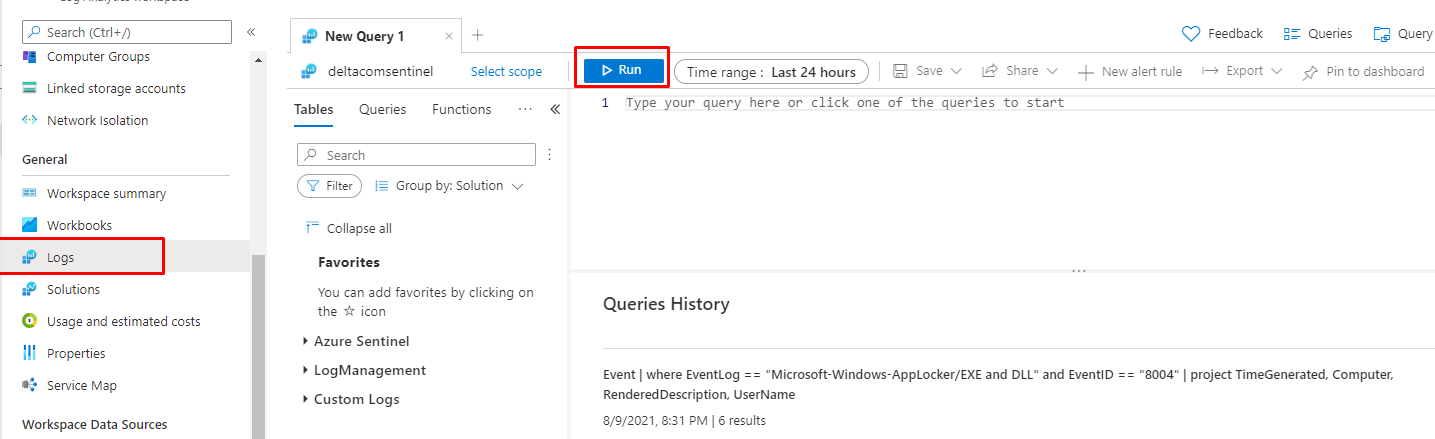
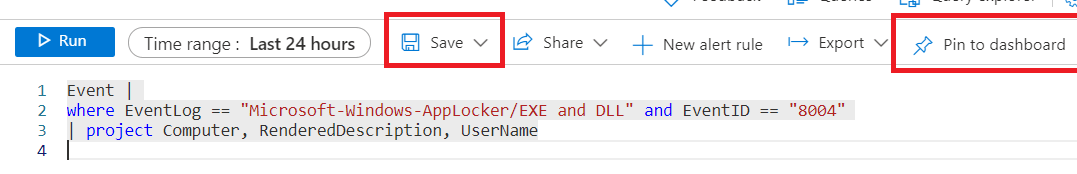
Now let’s test it by opening PowerShell (if you blocked it in your Applocker) and wait a few minutes to start a query.
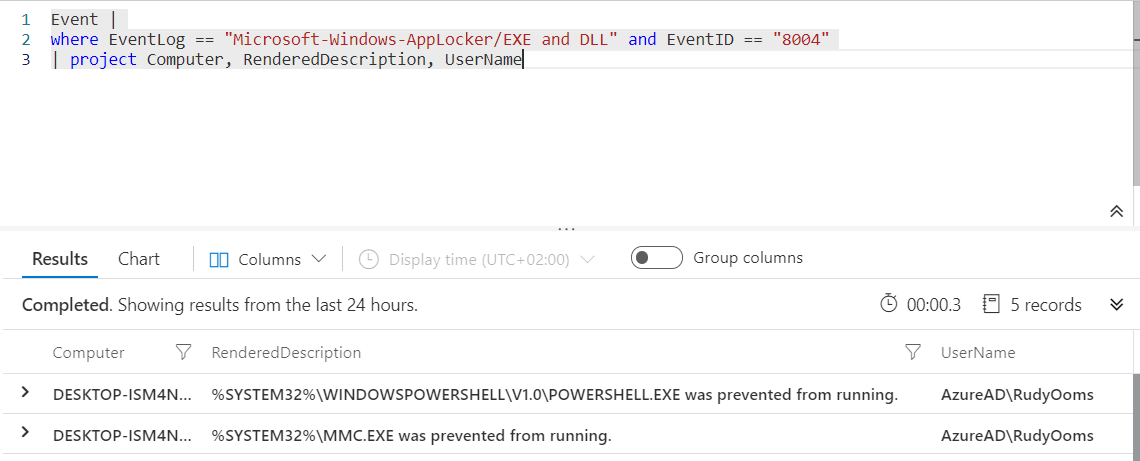
Event |
where EventLog == “Microsoft-Windows-AppLocker/EXE and DLL” and EventID == “8004”
| project Computer, RenderedDescription, UserName
6. Creating a new Dashboard
Now let’s create a dashboard to get a nice good overview of what’s happening with Applocker on all of our devices. If we want to make sure it’s in the Analytics dashboard, just press save and “pin to dashboard”
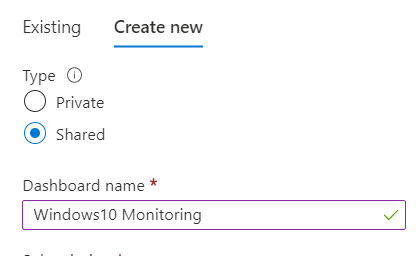
In this example, I am going to create a new dashboard for it
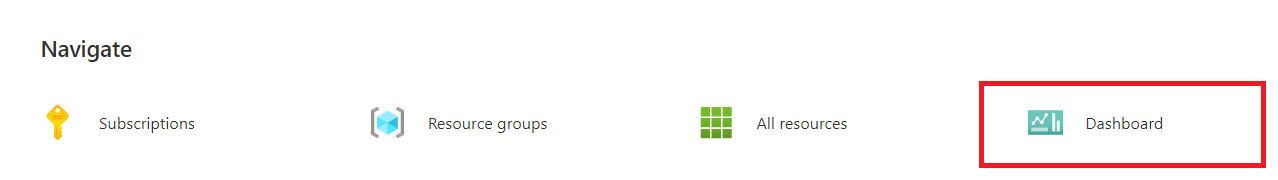
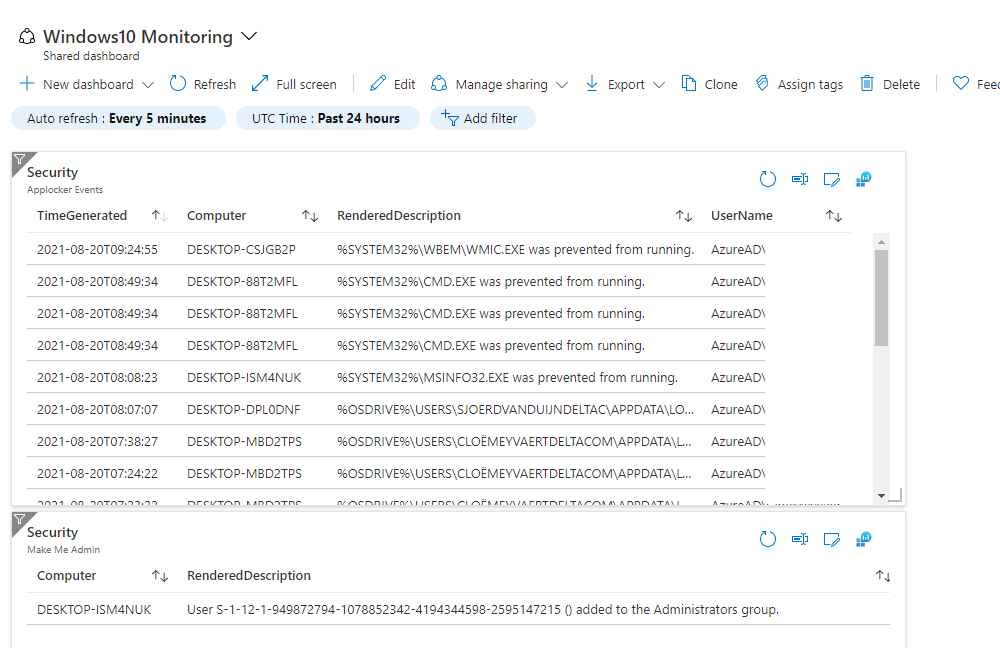
Let’s take a look at our Dashboard with our first Windows 10 Monitoring selection
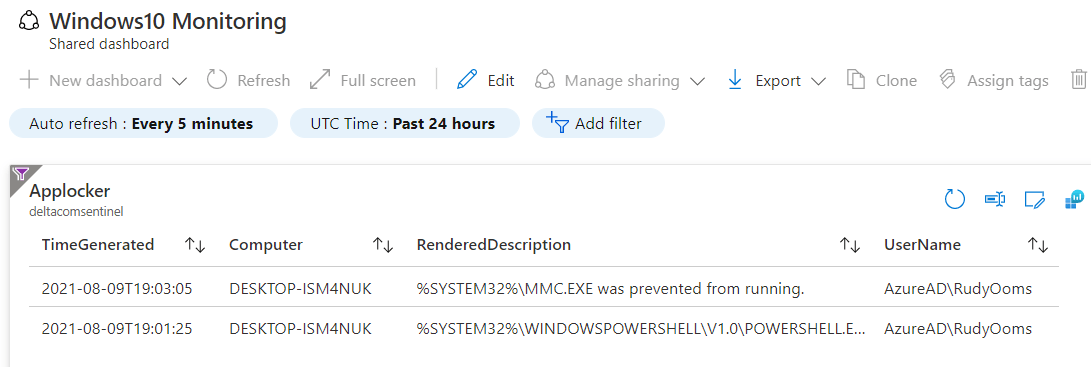
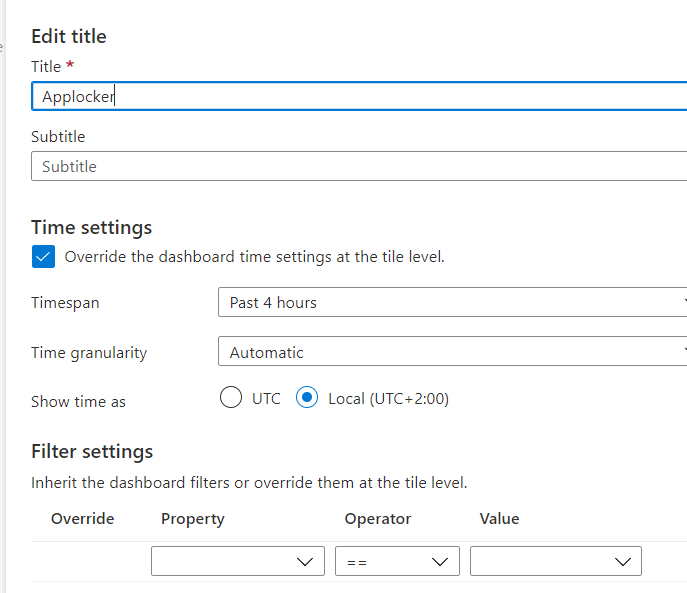
You could also change the name/TimeSpan and the Timezone like I did to get some nicer results. Click on the tile settings icon to do so
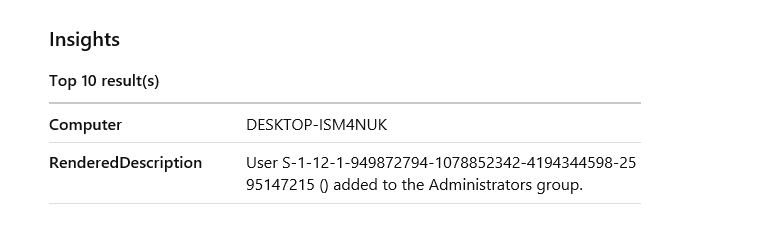
7. Adding the Make me Admin event logs
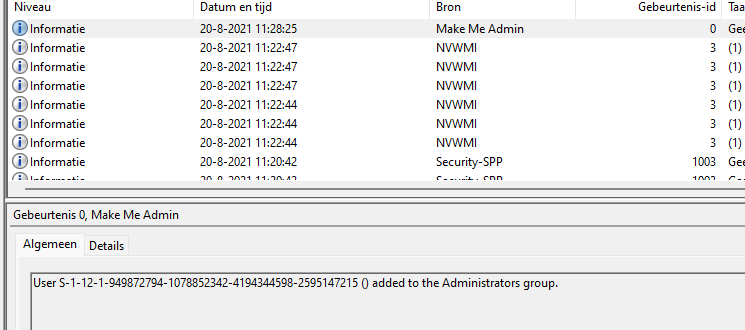
Now are doing a pretty job, why not add the Make me Admin event logs to the same Log Workspace so we can add it to our dashboard. Before we can do so, we need to know the events log Make me Admin is using. Open the event log and take a look.
First, add the Application Event log we need in the agent configuration section just like we did with the Applocker event logs

Now for the query, we need to put in this command
Event | where EventLog == “Application” and Source == “Make Me Admin” and EventID == “0” | project Computer, RenderedDescription
Save it and also pin it to your dashboard
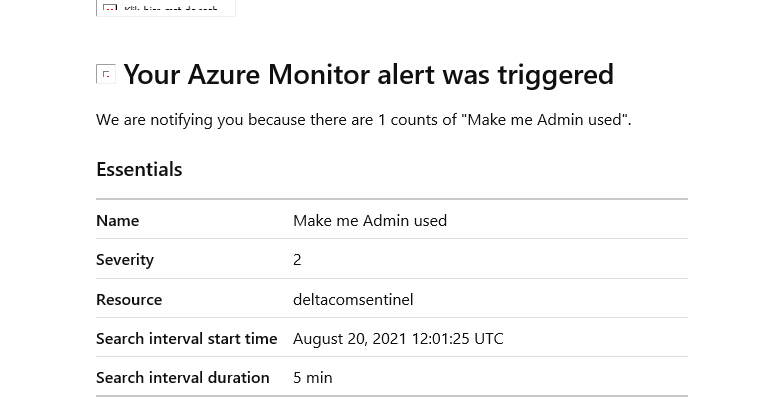
8. Maybe Adding an Alert rule?
If you want to be able to alert your Helpdesk or your ticket system, you can create an additional alert rule to make sure some people are alerted when an event occurs.
You can do so by opening your Log workspace again and clicking on “Alerts”
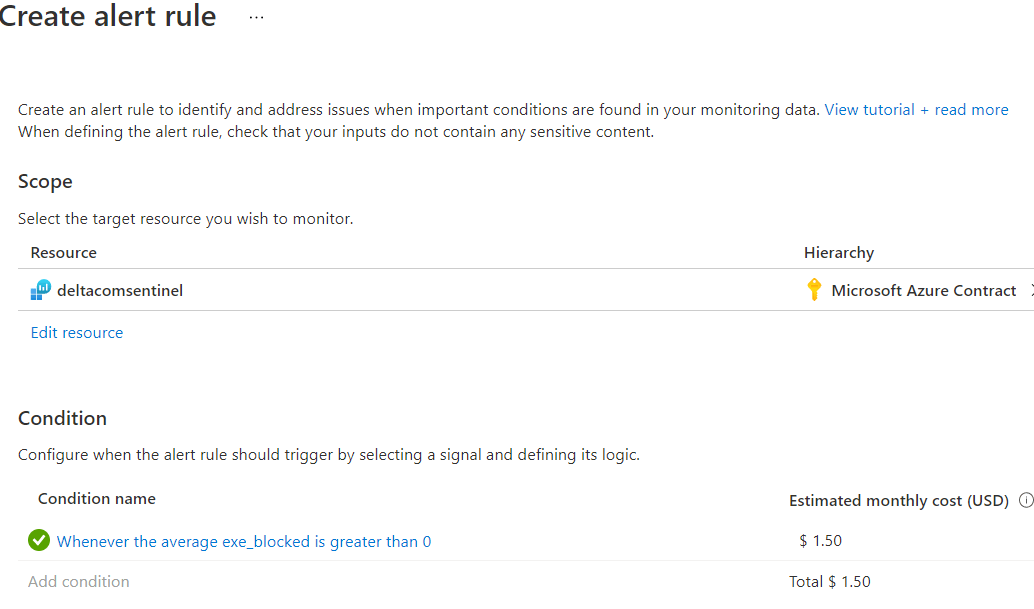
To begin creating a new rule, just click on “New Alert ” and select the conditions when we need to be alerted.

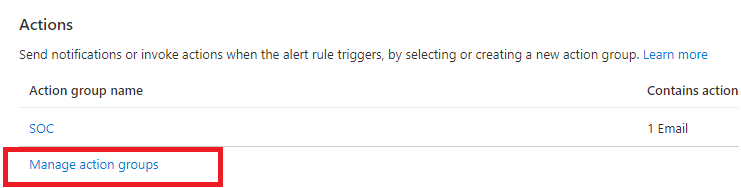
Please note: We also need to define an Action group with a corresponding email address attached to it, you could select an existing one or create a new one
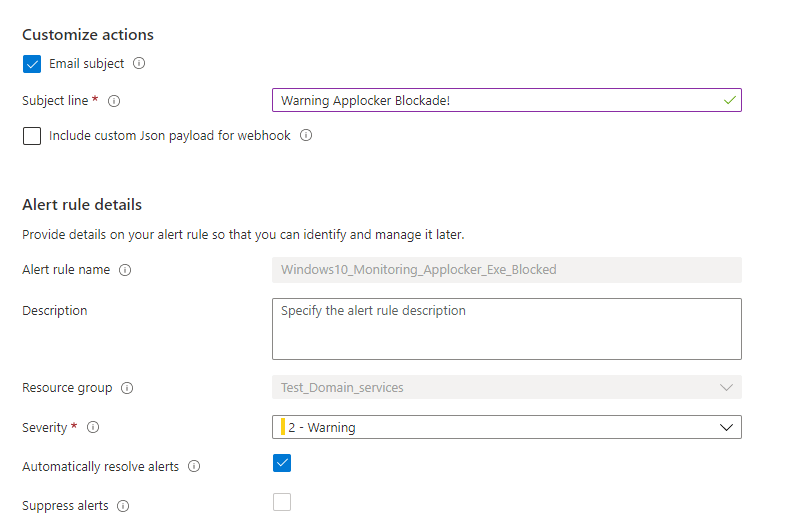
The results when you configured an Alert rule!
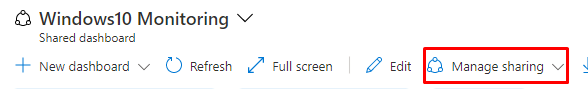
9. Sharing the Dashboard
If you want to share this dashboard with your colleagues you can do so by clicking “Manage Sharing” and “access control”
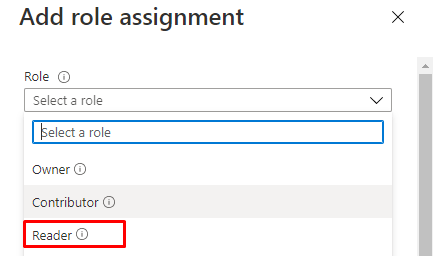
Click on “Add” to choose which role you want to give to which colleague.
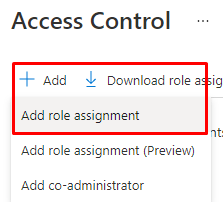
Select the proper role and the colleague you want to assign it to
Conclusion
Wouldn’t it be great that you wouldn’t have the need for an additional monitoring solution? You can add as much info to the dashboard as possible!
Whatever you choose, please use a monitoring solution

This is great!
However, for those customers that don’t want to to pay for log analytics the device diagnostics in Intune actually includes the applocker logs.
The issue is that the default app locker log sizes of each type of log is only 1GB. Seeing as how the applocker logs are very verbose and plentiful, by the time the user reports the issue and you click collect diagnostics the blocked log is already gone!
Is there any way in Intune to increase size of the AppLocker event log file? IT can be done manually via the log properites.