
In this blog, I’ll explain how we resolved an issue where saving the new Autopilot device preparation profile failed to save the device group.
1. Autopilot Device Preparation Introduction
To start using Autopilot Device Preparation, you must first configure the corresponding device enrollment profile, aka the Autopilot Device Preparation profile. One requirement is that you specify a device group.
This device group is a just-in-time group, aka an enrollment time group. It ensures that your device automatically becomes a member of this group during enrollment instead of after. This allows Intune to deliver configurations, reduce post-enrollment latency, and improve productivity quickly. Which is a nice improvement, right?
But what if it doesn’t seem to work when saving the device preparation profile? What if the device group isn’t shown after saving it?
2. The Issue
Let’s examine what seems to be happening so it starts to make more sense.
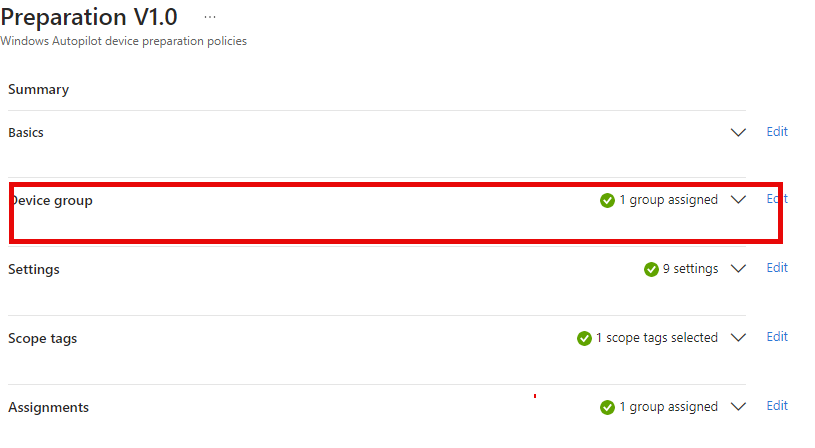
As we noticed in the video, the group does not appear in the profile after opening the Autopilot device Preparation profile, assigning the proper group, and saving. That’s weird, right?
3. Debugging the profile Issue
Luckily, there is an option to capture a browser trace, which we could use for troubleshooting. If you need to perform a browser trace, this Microsoft article explains how to set it up pretty well.
Capture a browser trace for troubleshooting – Azure portal | Microsoft Learn
I reproduced the steps to save the group with the browser capture configured. Once the profile showed no groups again, I saved the capture.
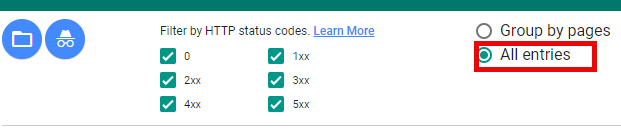
With the HAR file saved, I opened the HAR analyzer. Once I opened the HAR file and specified that I wanted to see all entries, I could scroll down to the time stamp the profile was saved.
Once I reached the proper timeframe, I searched for a graph POST. Within a few seconds, I got the one I was searching for…

It was performing a post to https://graph.microsoft.com/beta/deviceManagement/configurationPolicies(‘5b0d6483-1d63-454b-87f3-2c0f17e4c8ba’)/assignJustInTimeConfiguration
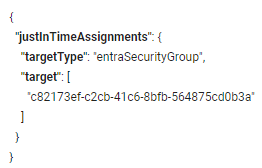
In the Post data, we will spot the proper entra security group in it

When looking at the status of the 200 that it gave us, it seems good. As you can see in the video, after saving the profile, we opened it again to see if the group was still in it.
We would notice this again in a graph call.

This time it will reach out to almost the same URL but just a bit different:
As shown above, it will retrieve the Just-in-time configuration instead of assigning the Just-in-time group. If we open the response content, we will see this! 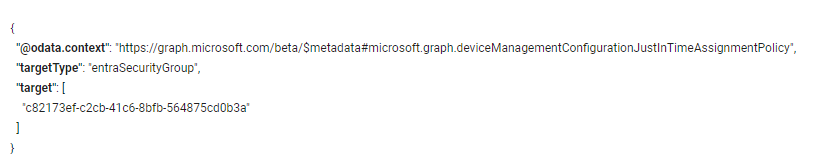
Huh.. okay, it was showing us the same Entra device security group we assigned to the profile? I wasn’t expecting that. To be sure, I opened the graph explorer and copy pasted the retrievejustintimeconfiguration graph URL, and clicked on Run Query
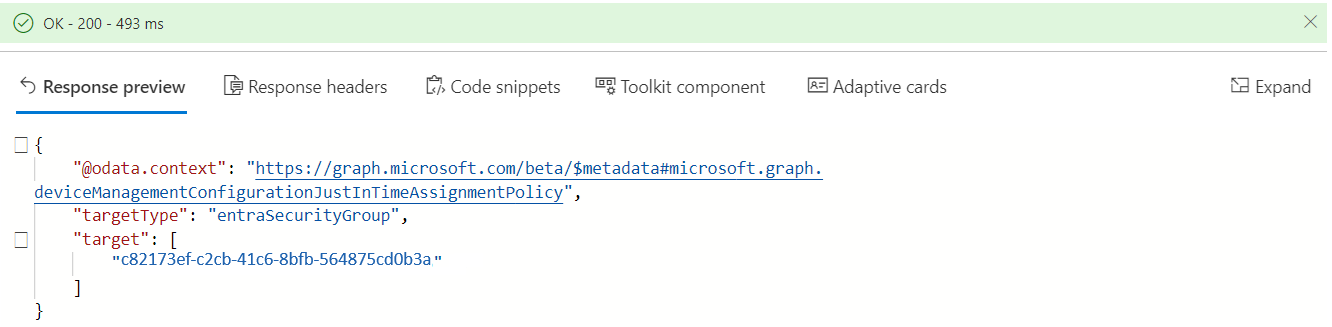
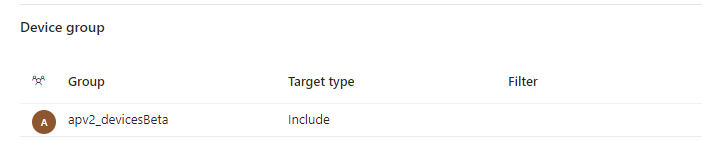
As shown above, the query also returned the proper group information configured in the Autopilot device preparation Profile!! That’s Nice!!
4. The UX Fix
After discussing this issue with MSFT, it became evident that a UX bug was found and needed to be fixed.
The funny thing is that your Autopilot Device Preparation enrollments should still work without the device profile showing the actual device group.
Luckily, Microsoft acted pretty fast, and the morning after, it was fixed. I
Conclusion
You don’t always need Fiddler to capture data to understand what is happening when communicating with the service and graph. Luckily, it was just a UX bug this time, but it taught me much about using the HAR analyzer to debug issues.
Another tool added to my troubleshooting arsenal! Ow And JCL, thanks for hearing me out 🙂
Good catch! I was thinking I’m going crazy :D. Good to know I was not the only one experiencing this 🙂
Had the UX bug in our tenant and even after it was fixed, the group still isn’t working. AP devices are not being added to the group and thus are not getting assigned apps…
I assume the intune client provisioning service principle is owner of that group?
It is, everything is setup according to the documentation.
So, they basically released this without testing it and ignoring feedback that was provided during the private preview? 🙂