In this blog, I will show you how to set up the Windows Performance Recorder and the Windows Performance Analyzer to troubleshoot Autopilot and Intune/MMP-C Enrollments. I will try to explain every single step in the process. Even how to configure the WPR file itself!
1. Introduction
When dealing with Windows Autopilot or Intune/MMP-C Enrollment issues, using Windows Performance Analyzer (WPA) in conjunction with Windows Performance Recorder (WPR) and Procmon can be incredibly effective. WPR allows you to capture detailed data, which can then be analyzed using WPA to diagnose and troubleshoot specific issues. The WPA tool is not only for investigating performance issues but also for troubleshooting other problems as well.
I will focus on why my Endpoint Privilege Management agent wasn’t installed because the corresponding MMP-C Enrollment wasn’t successful. To do so, I will only use the WPA tool to show you how I use that tool to determine where I should focus next.
From there on, you could use that information and timestamp to find out what happens during that timeframe in Procmon
Let’s examine what we must do to troubleshoot the MMP-C enrollment using the WPR and WPA tools. Of course, many more complex examples exist, but let’s start with the basics.
2. The Basics
Let’s start by configuring the Windows Performance Recorder. I will first guide you through the basics before zooming in.
2.1. Setting Up Data Collection with WPR:
Before we could start, we need to create a custom WPR file. We need to create a Custom WPR Profile, to be able to capture relevant data for Autopilot or Intune/MMP-C Enrollment issues. To capture this information, you must create a custom WPR profile with specific ETW providers related to these processes.
But how do we know which providers we need to configure? To identify relevant providers for Autopilot and Intune, you typically include providers who capture events related to device enrollment. If you want to know more about the WPR file, read part 3 of this blog
2.2. Recording Data with WPR:
Once we have configured the WPR file, we need to run WPR with the Custom Profile: wpr -start custom.wprp
With the trace running, let’s try to reproduce the Issue. In my example, I needed to kick off the scheduled task

Ensure that the problem occurs while recording is active. Once the issue has been reproduced, stop the recording to save the trace file: wpr -stop output.etl
2.3. Analyzing Data with Windows Performance Analyzer:
Launch the Windows Performance Analyzer and open the generated output.etl file from the previous step.
Filter and Zoom: Use WPA’s filtering and zooming capabilities to narrow the data to the relevant time frame and events. This can help pinpoint the exact cause and timestamp of the problem.
If you want to know more about the WPA tool, read part 4 of this blog
3. The WPR file
Let’s zoom in on the WPR file that we need to create. The WPR file must contain
-The EventProviders (the data sources that need to be captured for Event tracing)
-Buffers, Logging settings
Download this wpr example that I used to troubleshoot this issue:
https://call4cloud.nl/wp-content/uploads/2024/05/autopilotmdm.zip
3.1 Buffers
Let’s start by looking at the first few lines in the WPR file. These lines contain the buffer size configuration.

When configuring the buffer size and the number of buffers in a WPR profile, it’s essential to balance capturing enough data to be helpful and not overwhelming the system resources. The buffer settings determine how much data can be held in memory before being written to disk, which affects both the system’s performance during tracing and the comprehensiveness of the captured data.
If you misconfigure the buffers to try to capture everything and not select the proper providers, you could end up with a huge ETL file and, with it, also losing important traces
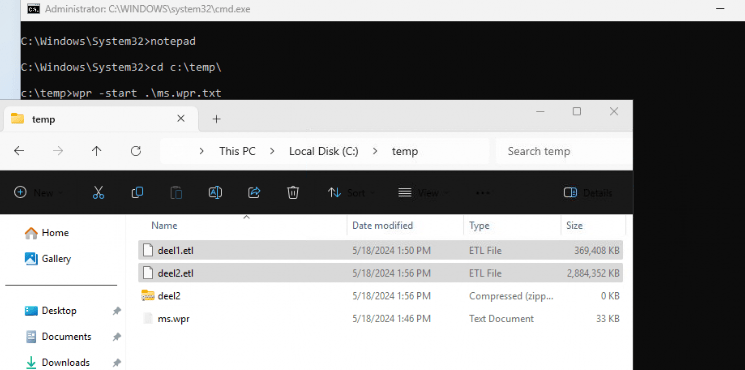
Considerations for Buffer Configuration
System Resources: Higher buffer sizes and counts consume more memory and disk I/O, which can impact system performance,
Event Volume: If the traced processes generate a high volume of events (authentication attempts or all the nodecache stuff that comes down with Intune), larger and more numerous buffers help ensure no data is lost.
Trace Duration: For long-running traces, more buffers are needed to accommodate the data. Conversely, for short, high-intensity traces, increasing the buffer size might be more beneficial. So, guess what I did to make sure I could capture everything I wanted.
Let’s move on to the ETW providers now we configured the buffers.
3.2 The ETW Providers
We must define the providers we want to capture during the trace, but how do we know which providers we need? Well… Windows comes with tools and documentation to help you discover ETW providers:
Logman Tool: You can use the logman command-line tool to list all available ETW providers on your system.
logman query providers
This command will list all providers registered on the system and their GUIDs. Alternatively, you can use the WEP Explorer to find those providers.
WinTools/WEPExplorer/Binaries/WEPExplore_v1.2.zip at master · 0xeb/WinTools · GitHub
These tools could give you a couple of good ETW providers to capture, but for me, that’s not enough. So, what do I use? This list of ETW providers: ETW providers you never knew existed… · GitHub
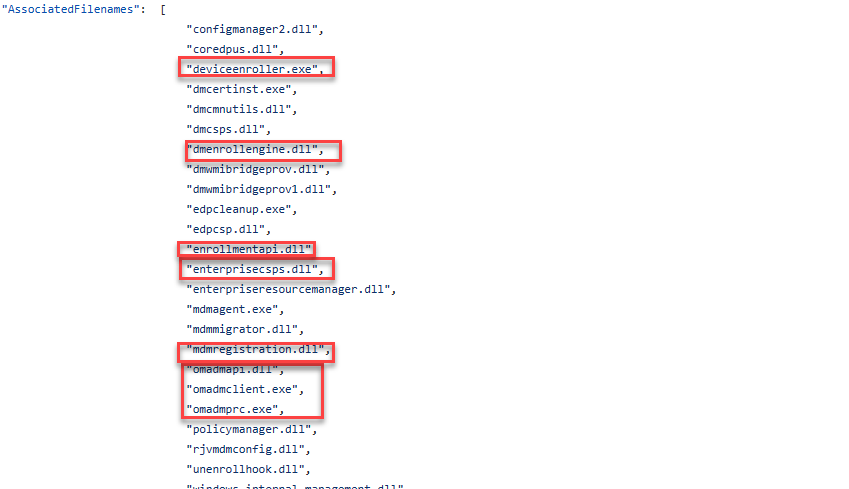
This list contains the ETW providers and their GUIDS, but it also mentions the corresponding DLL files. If the device is being enrolled, three very important DLL files will handle the enrollment task.
Dmenrollengine.exe, mdmregistration.dll, and, of course… the fight club executable: deviceenroller. If we search through that nice big JSON file, one of the providers we want to add is the EMPS.Enrollment one

This important event provider is associated with these dll,exe files (again knowing your DLL files, is quite important!)
3.3 Adding the Providers
When looking at the WPR example I gave you, you will notice that at the top of the file, I first added all the providers I want to be able to capture
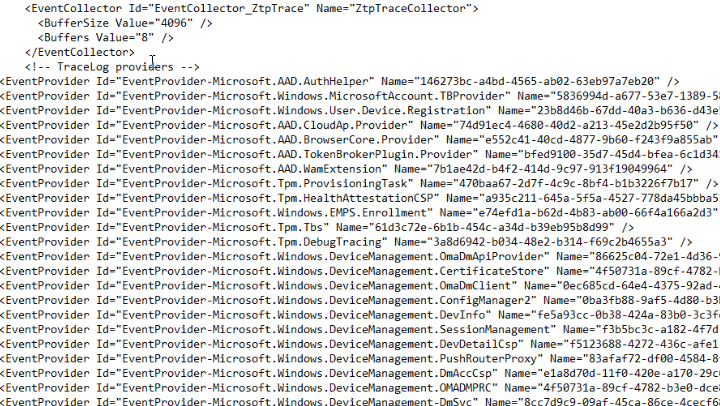
When scrolling down the wpr file, we notice a smaller subset of providers. In this section, I am configuring the providers I want to capture.
 In the first few lines of this section, I also configured the detail level to verbose. I guess it’s obvious that I want to capture every single detail. With the detail setting configured, I configured the providers I wanted to capture.
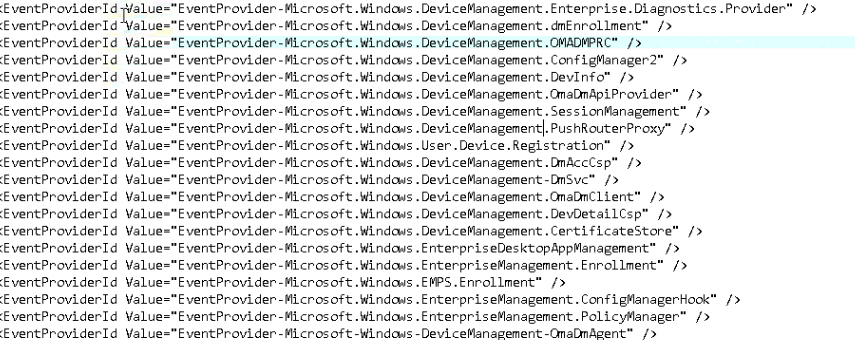
This section needs to be changed depending on what you want to be able to capture. If you need trace logging to troubleshoot some Autopilot errors, you definitely want to add some others.
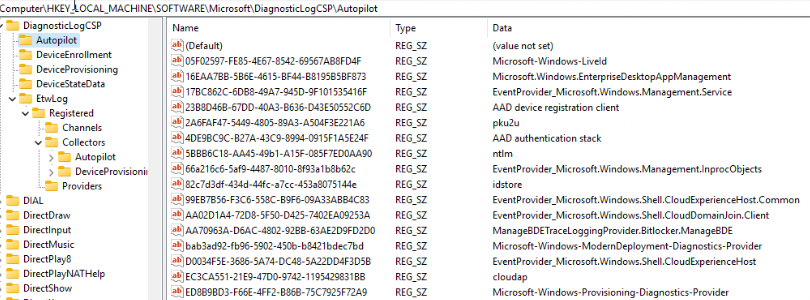
You can find them by querying the DiagnosticLogCSP. This one holds all the event providers Microsoft cares about AKA All the Windows Autopilot event logs.

The corresponding data can be found in the registry. Which makes it easier to find the attached name
4. The WPA tool
So, we configured a WPR configuration file. With the WPR file we were able to kick off the wpr trace by using wpr -start configfile.wpr
Once we know that we have reproduced the error, we could stop the trace with wpr -stop logfile.etl
Now, it’s time to examine the etl file. We could use the Onetrace tool or the WPA tool to open it. I am going to use the WPA tool. Open the Microsoft Store and search for Windows Performance Analyzer (yeah, it’s in the store… isn’t that great?).

Install the tool and double-click the ETL file.
Once we opened the etl file, this is what we would get…
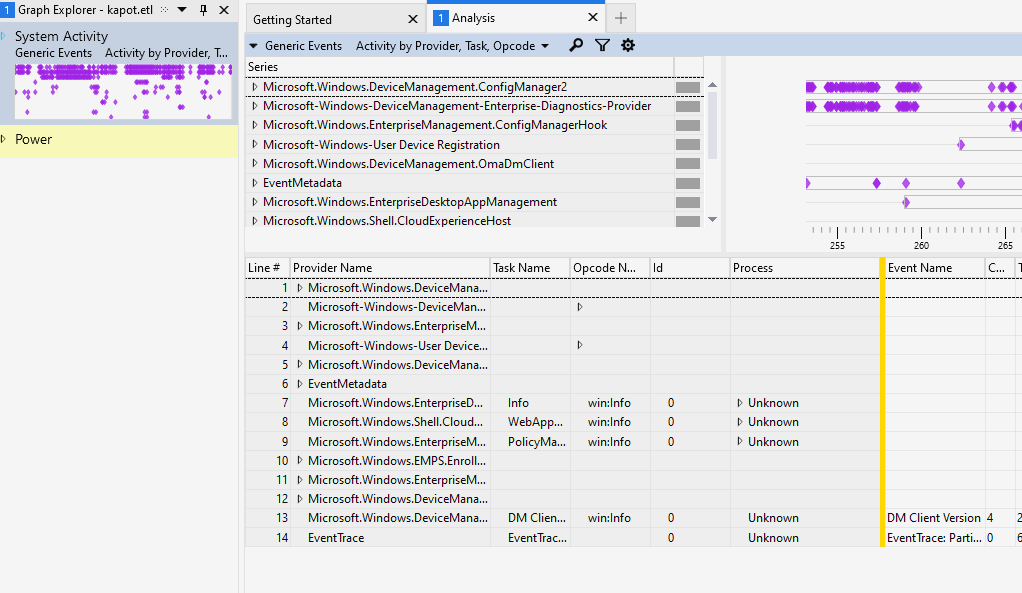
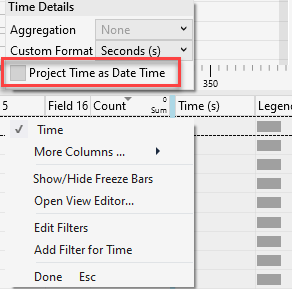
As shown above, all the providers we configured are displayed, and we could expand the provider to find out more. Make sure you project the time as the date. Enabling this functionality makes getting the specific time when it breaks is much easier.
Now, let’s zoom in to the ETL file we got to find out what’s happening. This time, it’s just an easy example, but to point out why using the WPA tool could help you pinpoint the issue.
5. The ETL file
After opening the ETL file, I noticed a lot of essential event providers. I know it is an enrollment issue… so I start with looking at the windows.emps.enrollment

Why? As mentioned earlier, it’s all about knowing the dll files and which provider belongs to them. Finding the proper event providers and getting used to the WPA tool will take some time.
If we look a bit closer to the ETL file we just opened, It’s good to know that when clicking on such a field, the name above changes to the proper name.

When looking back at the EMPS.Enrollment, and what that particular field shows me, we will notice that the enrollment gave the 0x80004003 error.
Besides this first error, it also showed me the timestamp… A timestamp makes things much easier because I know the exact time it broke. Most of the time, it is all about combining information. Only relying on WPA could sometimes be difficult, but when combining that same information with Procmon makes it way easier to spot something.

The funny thing about this issue is that Microsoft updated its logging capabilities so that the etl trace and the event log now mention the issue!


The WPA tool showed me where I needed to focus and which time frame was important. That
Please read this blog to learn more about my deep dive into the Config Refresh bug that broke everything that needed the Enterprise Device ID.
Config Refresh Bug | Failed to Enroll | EmmDeviceID | Intune (call4cloud.nl)
6. IDA
Cool, right? We spotted the issue, but how could we step it up a notch to come up with a workaround or hand over our findings to Microsoft?
With the WPA tool, we could spot which functions the process uses. Knowing the function name makes understanding what is going in the flow easier.
If I open the dmenrollengine.dll (file responsible for enrollments) with the IDA tool and do a quick search, we will notice the “Logenrolldualdenrollmententdmidnotfound” being mentioned.

This logger is part of a bigger function. To be precise, the createenrollmessage function. This function is responsible for creating the enrollment message (with details of the device) that will be sent out to the service.

The funny thing is that if you use the graphical view, you can double-click on the green line above the function. This would lead you to the function responsible for fetching the EnrollmentID
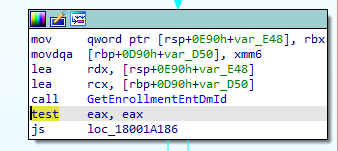
That function can also be opened and looked at… and again, down the rabbit hole we go. But I am going to save you that trip. I only wanted to make my point about how the WPA tool is very good at telling you what is going on!
Conclusion
The WPA tool can be handy if you want to know what’s happening during your Enrollment and start troubleshooting. It doesn’t mean that only using the WPA tool and the traces could always tell you what’s going on. BUTTTT if you have the same ETL file from a working enrollment and could compare it with a broken one…. It could give you insights into what is breaking your enrollment and, more importantly, at which step and time stamp!
Want to read more? read my latest blogs here!
- Continue to Sign in Prompt Part 2: Disable the DMA SSO Compliance
- The “Continue to Sign in Prompt” That breaks the SSO
- Declarative Device Management with Intune
- Why Using a DEM Account for Windows Autopilot is a Bad Idea
- Device Query for Multiple Devices, Device Inventory, and Single Device Query: Connecting the Dots


