

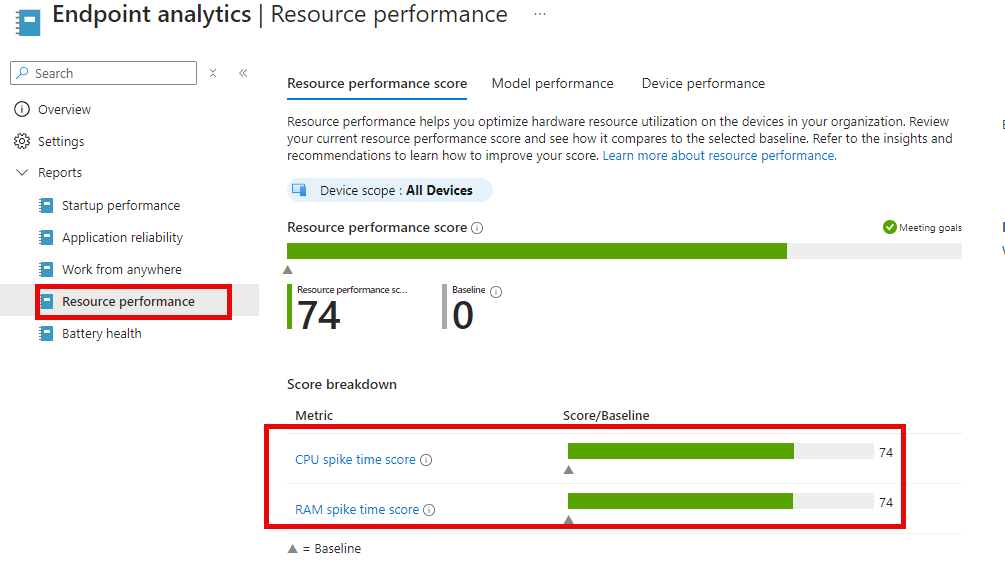
Two powerful features have been introduced in the latest update to Microsoft Intune Advanced Analytics: CPU Spike and Memory Spike monitoring. We can spot them when we take a look at the new Resource Performance report.
These features are crucial for IT administrators aiming to optimize device performance and user experience. By leveraging these tools, organizations can proactively manage device health, ensuring that systems run efficiently and users remain productive.
Before we discuss how these features work in detail, let’s review some important prerequisites and configurations.
Prerequisites and Configuration for Device Health Monitoring (DHM)
To fully utilize the Device Health Monitoring (DHM) features within Microsoft Intune’s Advanced Analytics, it’s essential to meet the following prerequisites and configure the necessary policies:
Licensing:
- Ensure your organization has the appropriate Intune Suite or add-on licenses, which include access to Advanced Analytics capabilities. For Cloud PCs, a Windows 365 license is necessary.
Device Enrollment:
- Devices must be enrolled in Intune and configured to send diagnostic data. This is crucial for enabling the comprehensive monitoring and analytics features.
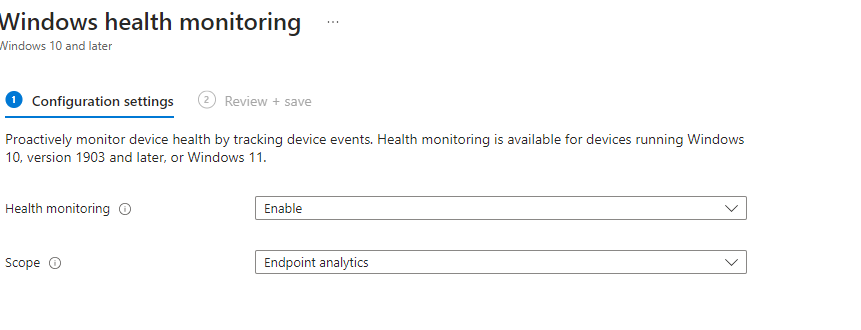
Windows Health Monitoring Configuration:
- Navigate to the Windows Health Monitoring policy in the Intune Admin Center. This policy allows you to enable health monitoring for devices running Windows 10 (version 1903 and later) or Windows 11
- Set Health monitoring to Enable and select the Scope as Endpoint analytics. This ensures that the devices send the necessary health data to Intune for analysis.
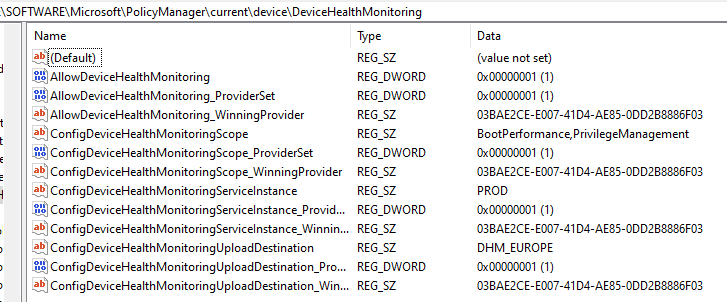
DHM_Europe Configuration:
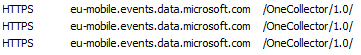
- When you configure the Windows Health Monitoring policy and set it to enable Device Health Monitoring, the system automatically configures certain registry settings on the device. For organizations operating in Europe, the registry key ConfigDeviceHealthMonitoringUploadDestination is set to DHM_EUROPE, directing data to appropriate regional endpoints such as eu-mobile.events.data.microsoft.com/OneCollector/1.0/. This ensures compliance with regional data sovereignty regulations. The registry settings, as shown in the screenshot, confirm that the device is correctly configured for European data centers.
Diving Into Advanced Analytics: CPU and Memory Spike Monitoring
With these prerequisites in place, you can start leveraging the advanced features offered by Intune’s Advanced Analytics. Here’s how CPU and Memory Spike monitoring works:
The Hidden Heroes: DLLs and ETW Providers
At the core of these new capabilities is the Microsoft.ConfigurationManagement.SensorFramework.dll.

This DLL is a crucial component of the Intune Management Extension (IME), overseeing the monitoring and data collection of both CPU and memory spikes. Let’s break down how these two monitoring features work:
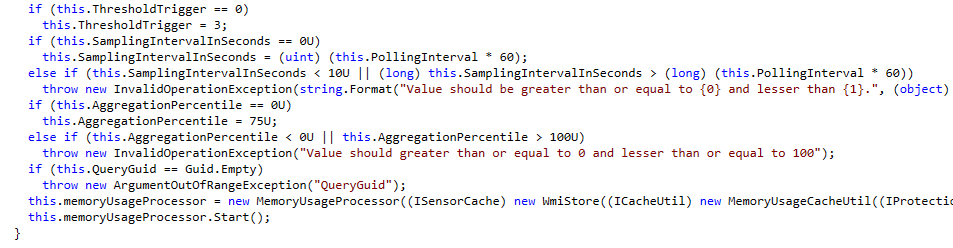
Memory Spike Monitoring with MemoryUsageProcessor:
This class within SensorFramework.dll continuously tracks memory usage on client devices.
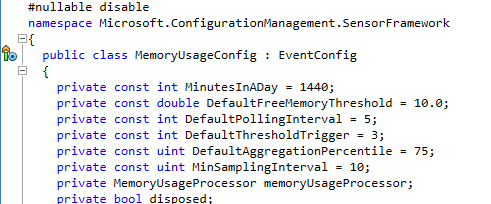
When free memory falls below a set threshold (such as 10%), the system logs this as a memory spike. These spikes are then aggregated and contribute to the “RAM spike time %” metric in Advanced Analytics, which is typically averaged over a 14-day period.
This allows IT admins to identify trends and potential performance issues related to memory usage.
CPU Spike Monitoring with CpuSpikeConfig:
The CpuSpikeConfig class leverages Event Tracing for Windows (ETW) to monitor CPU activity in real-time. It uses the “Microsoft.Windows.CpuTrigger” provider, identified by GUID 635d9d84-4106-4f3a-a5c2-7fda784ae6fc, which is associated with appsruprov.dll.
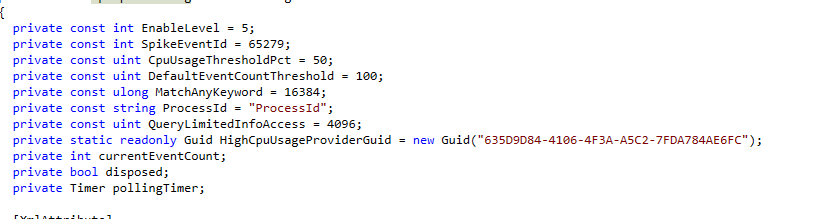
This provider is specifically designed to detect high CPU usage events—when CPU usage exceeds 50%, for instance. The class counts these events, and if they surpass a certain threshold, it logs them for further analysis. These logs are then used to create a comprehensive view of CPU performance over time, feeding into the broader analytics provided by Intune.
From the Client to the Cloud: Data Flow in Advanced Analytics
The data collected by these components follows a path from real-time monitoring on the client device to in-depth analysis in the cloud:
- Real-Time Monitoring: The SensorFramework.dll manages the monitoring of CPU and memory usage spikes on each client device.
- Event Triggering: When a spike is detected, whether in CPU or memory, an event is triggered and logged.
- Data Aggregation: These events are aggregated over time, typically in periods like 14 days, providing trend data.
- Device Health Monitoring Reporting: The aggregated data is then transmitted to the Intune cloud service as part of Device Health Monitoring, where it contributes to the Advanced Analytics dashboard.

This offers insights into device performance trends, allowing IT admins to identify and address potential issues proactively.
What This Means for IT Admins
With these Resource Performance enhancements, IT administrators gain the ability to:
- Proactively Manage Device Performance: Quickly identify and resolve performance bottlenecks before they impact users.
- Optimize Resource Allocation: Use detailed insights to decide when to upgrade hardware or adjust configurations.
- Enhance User Experience: By monitoring spikes and trends, admins can ensure that devices run smoothly, reducing disruptions for users.
Wrapping Up
The integration of SensorFramework.dll and ETW providers like appsruprov.dll within the Intune Management Extension offers a robust framework for monitoring and managing CPU and memory spikes. These capabilities ensure that IT administrators have the tools to maintain optimal device performance across their organization.
For more in-depth information, check out the Resource Performance report in Microsoft Intune Advanced Analytics.